My Bitcoin analysis: from the 126K top to the 2026 cycle correction
A review of my October and December Bitcoin videos: 122K-126K resistance, EMAs, regression, seasonality, cycles and the current BTC situation.
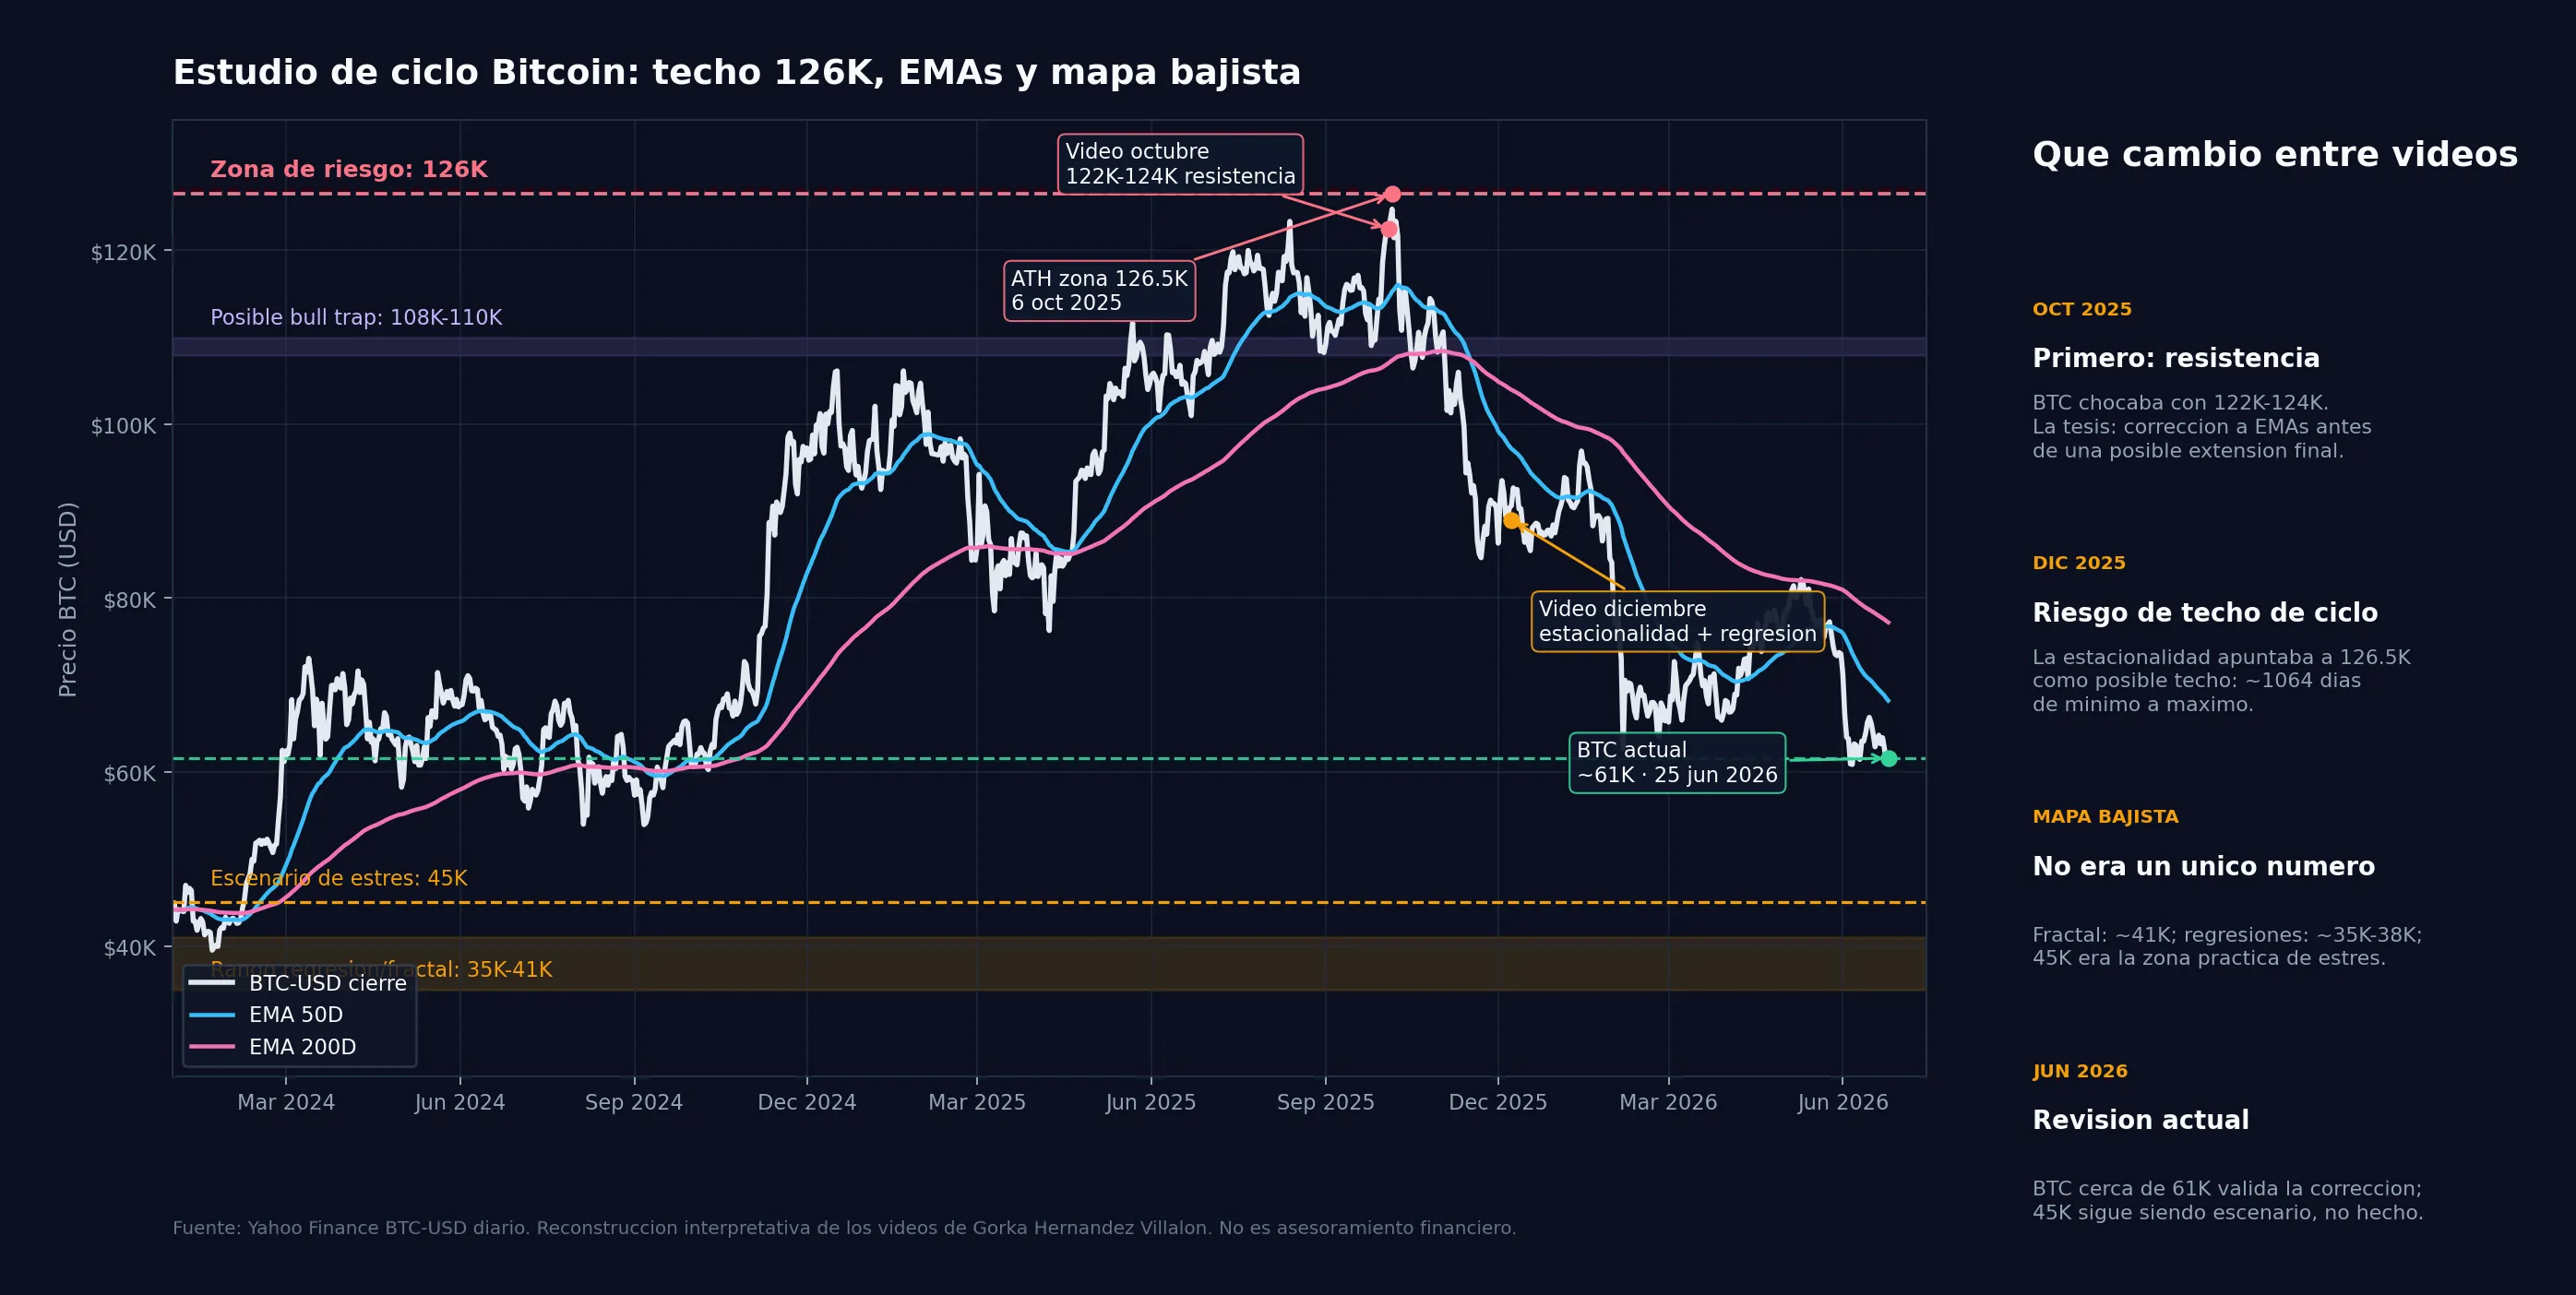
This article reviews two Bitcoin analyses I published on thePalms and, with the perspective of June 2026, explains how my cycle view evolved.
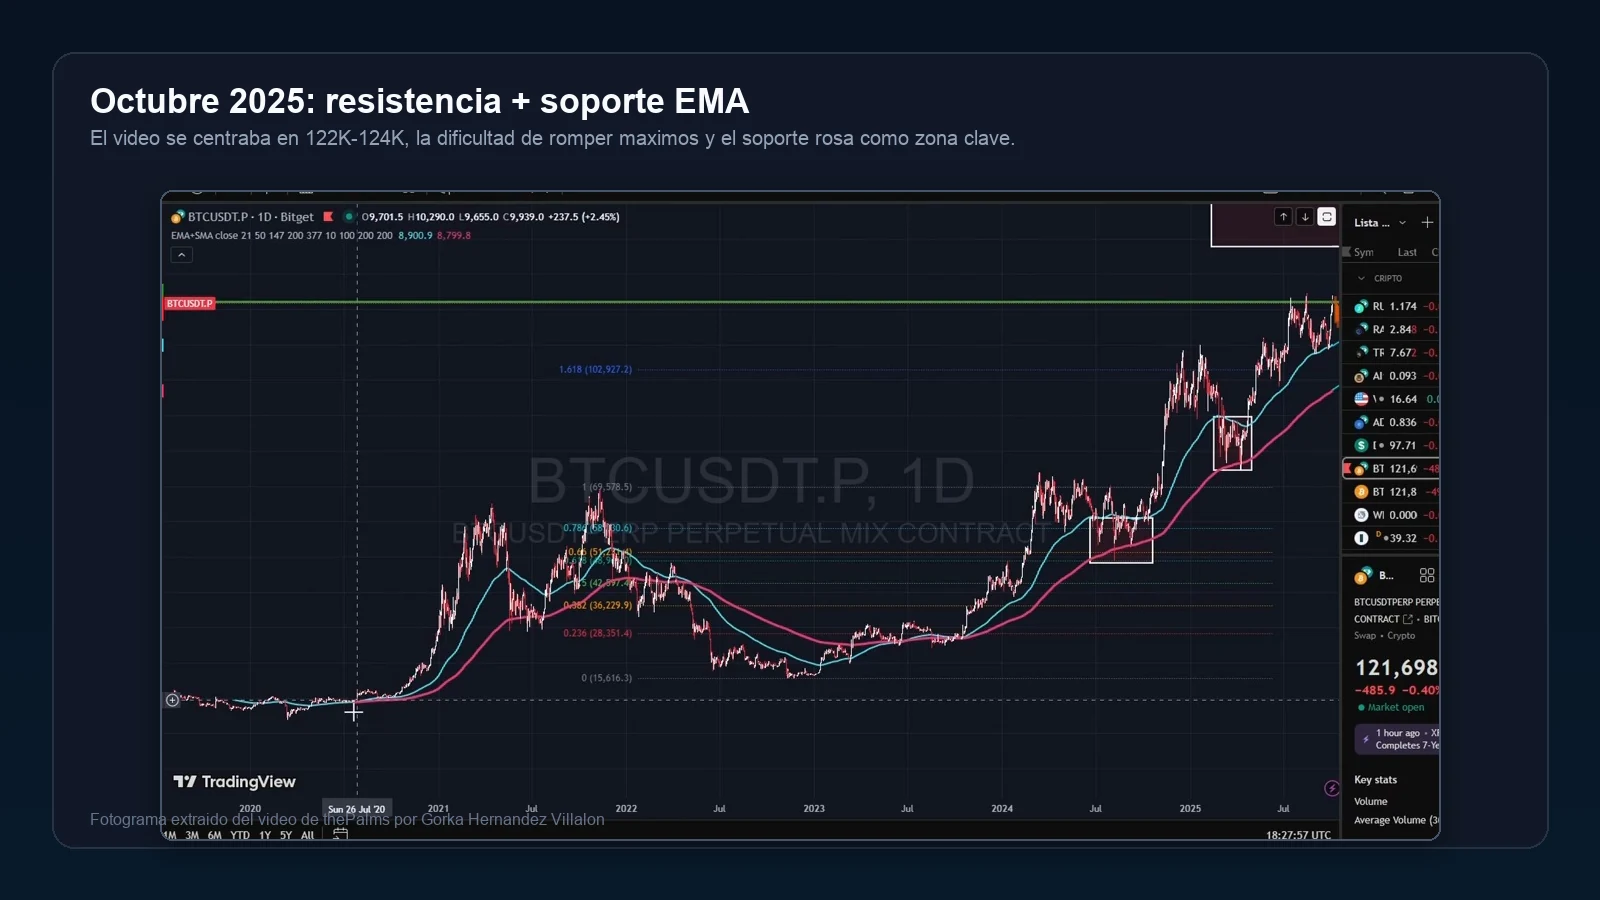
The first video, published on October 4, 2025, was not a pure bearish call. The idea was that Bitcoin was facing historic resistance around 122K-124K and that, before a possible extension toward 140K-150K, it probably needed to correct into EMAs that had worked as dynamic supports during the bull market.
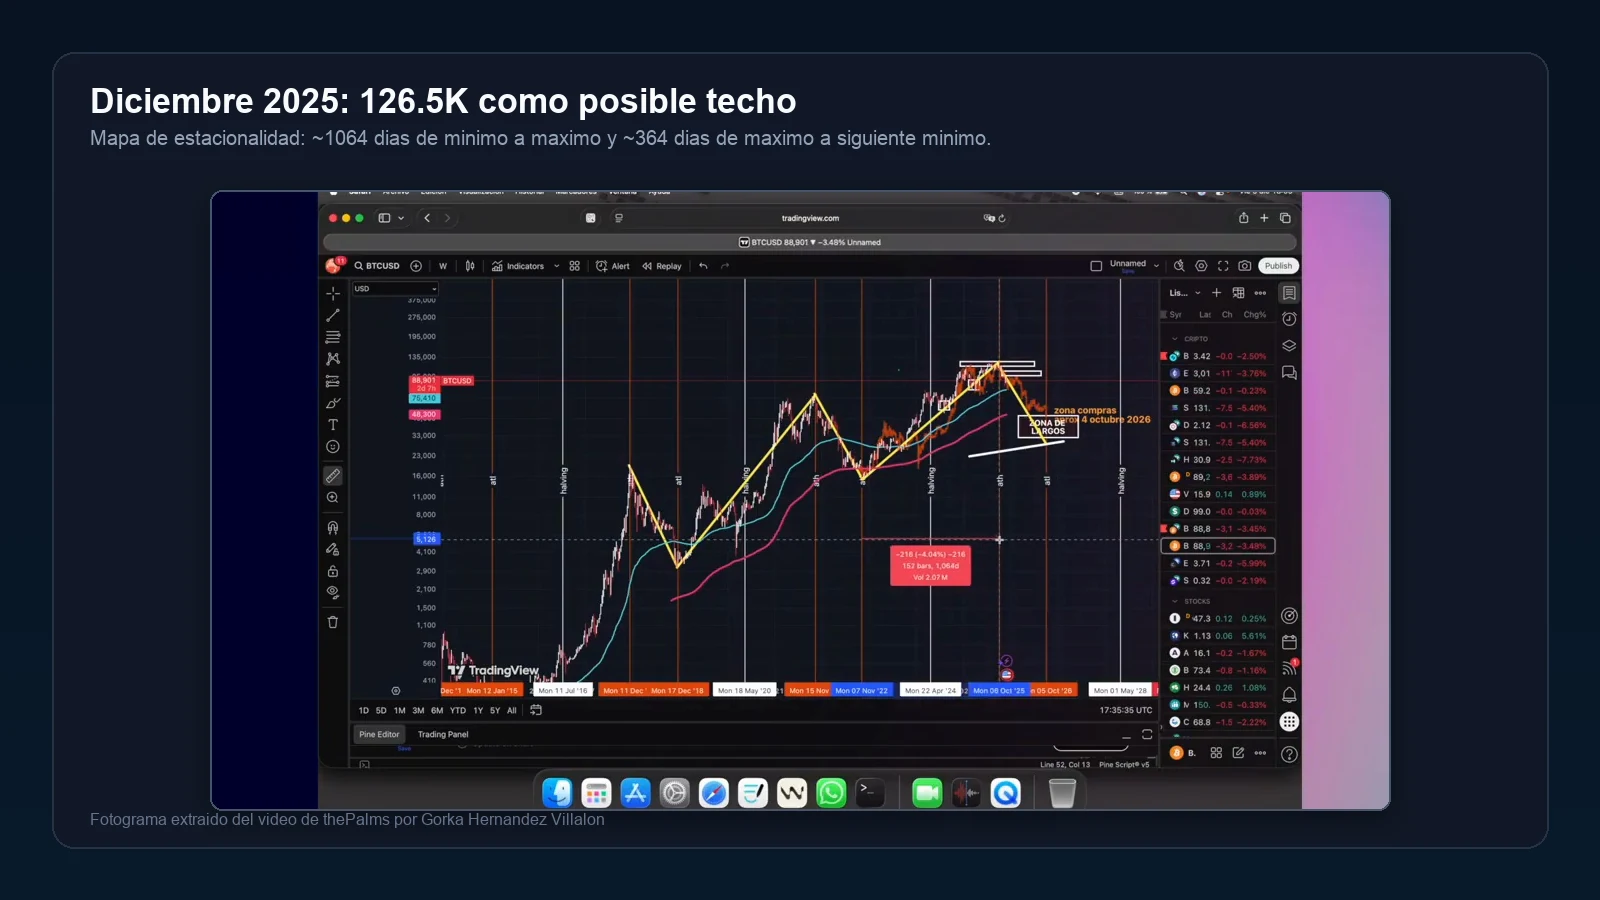
The second video, published on December 8, 2025, changed the framework. I was no longer looking only at a healthy correction inside an uptrend: I added seasonality, cycle timing, fractality and regression models. The conclusion was more defensive: the 126K-126.5K area could already have been the cycle top, and the market could enter a bear phase with much lower targets.
This is not financial advice. It is a technical and retrospective review of a market thesis: what was said, what aged well, what did not and which parts of the reasoning still look useful.
Direct answer
My view evolved in two stages. In October 2025, Bitcoin was pressing into 122K-124K resistance and was struggling to break highs with strength. The scenario I described was a correction into key EMAs, especially the pink support area, before a possible final push toward 140K-150K.
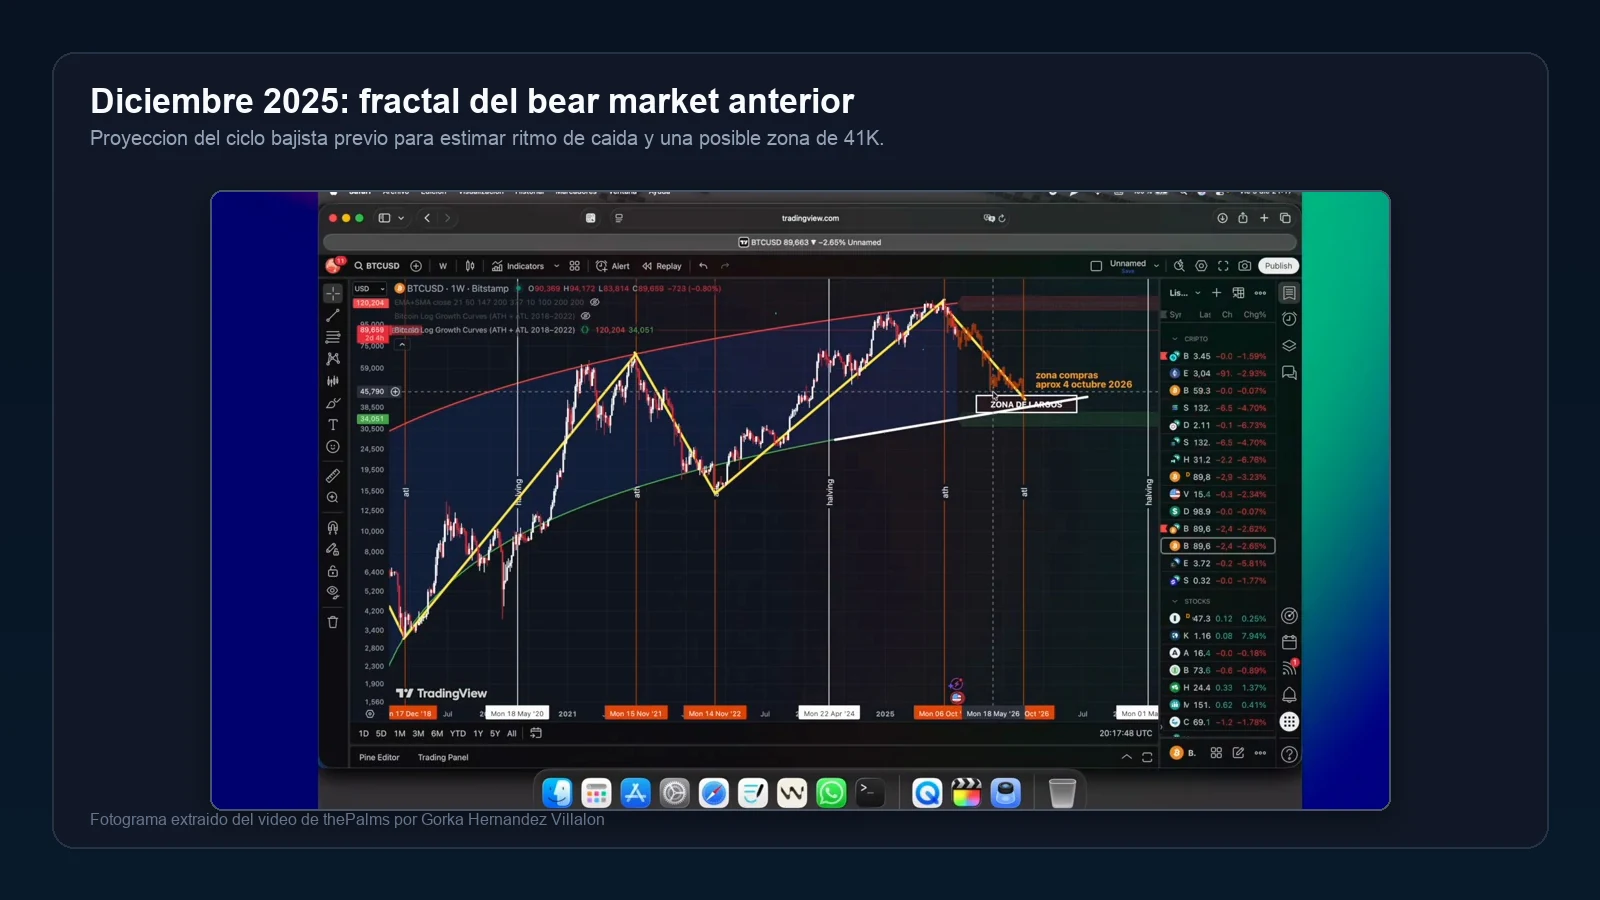
In December 2025, after reviewing seasonality and cycles, the bias changed: if the 126.5K high was the cycle top, the next step did not have to be bullish continuation. It could be distribution and a bear-market phase. In that video I used three references: Bitcoin's timing structure, a previous bear-market fractal and two regression models. The result was not one exact price, but a risk map: 35K-41K from models, 45K as a practical stress level and possible bull-trap rebounds along the way.
As of June 25, 2026, Bitcoin trades near 61K USD according to YCharts and CoinDesk. The top/correction thesis has aged well: 126K was the relevant cycle top area and BTC has corrected more than 50% from there. The 45K area has not been reached yet; it remains a stress scenario if structure keeps failing.
Thesis timeline
| Date | Video | Core idea | Status as of June 2026 |
|---|---|---|---|
| Oct 4, 2025 | Bitcoin at historic resistance | 122K-124K resistance, EMA correction and possible final extension | The resistance was real; the market topped shortly after |
| Dec 8, 2025 | Seasonality predicted it | 126.5K as possible cycle top, bear fractal and 35K-41K regressions | The correction was confirmed; the extreme scenario remains open |
October video: resistance, EMAs and possible final push
In the October video, the key idea was that BTC had entered a decision zone. Price had been making new highs, but each new high looked less forceful. The transcript repeatedly points to the same issue: Bitcoin was around 122K-124K and was struggling to break previous all-time highs with real strength.
My hypothesis at that point was:
- BTC could correct before truly breaking out.
- The first EMA acted as the initial weakness warning.
- The pink EMA was the important dynamic support.
- During previous bull-market corrections, price had lost one average, tested the lower one and bounced before the next impulse.
- If the pattern repeated, the drop did not invalidate the bull cycle; it could prepare a final upside move.
- The possible upside target was 140K-150K, but only if the moving-average structure held.
That condition matters. The video was not saying "buy any dip". It said the correction made sense if it reset the move and respected the pink support. If price lost structure, the analysis changed.
Why the EMAs mattered
The EMAs turned a narrative into an observable map. Resistance can tell you that price is in a difficult zone, but moving averages help answer the next question: if price corrects, is the trend still alive or is it breaking?
At that point I used them as a ladder:
| Signal | Reading |
|---|---|
| Price above EMAs | Bull trend still alive |
| First EMA loss | Correction likely, but not necessarily cycle end |
| Move into the pink EMA | Zone where a bounce was expected if the bull market was healthy |
| Clear break of pink support | Regime-change warning |
| Weak bounce below averages | Possible bull trap or distribution |
In hindsight, the key was not only identifying 126K. The key was having an invalidation rule. If the EMAs stopped acting as support, the 140K-150K scenario lost quality.
December video: seasonality changed the bias
The December video was broader. It starts by reviewing the earlier point: Bitcoin's difficulty in breaking highs with strength and the need for a moving-average correction before continuing higher. But then the new piece appears: seasonality.
The idea was that Bitcoin tends to behave in phases because of its cyclical nature and halving structure. In the video I worked with two time references:
- around 1064 days from cycle low to cycle high;
- around 364 days from cycle high to the following low.
Projecting those times onto the current cycle produced a powerful reading: the 126.5K high could already have been the cycle high. That did not make the model mathematically guaranteed, but it did change the bias. The question was no longer "when does BTC break 150K?" but "what if the top has already happened?".
Previous bear-market fractal
After the timing count, I used a visual technique: projecting the previous bear-market decline onto the current cycle. This is not meant to predict every candle, but it helps compare rhythm, intermediate rebounds and likely depth.
That fractal suggested a move toward the 41K area. The important part was not treating 41K as a magic number, but as an independent reference aligned with the bear-market thesis: if the top was already in, price could fall much further than the bullish narrative wanted to accept.
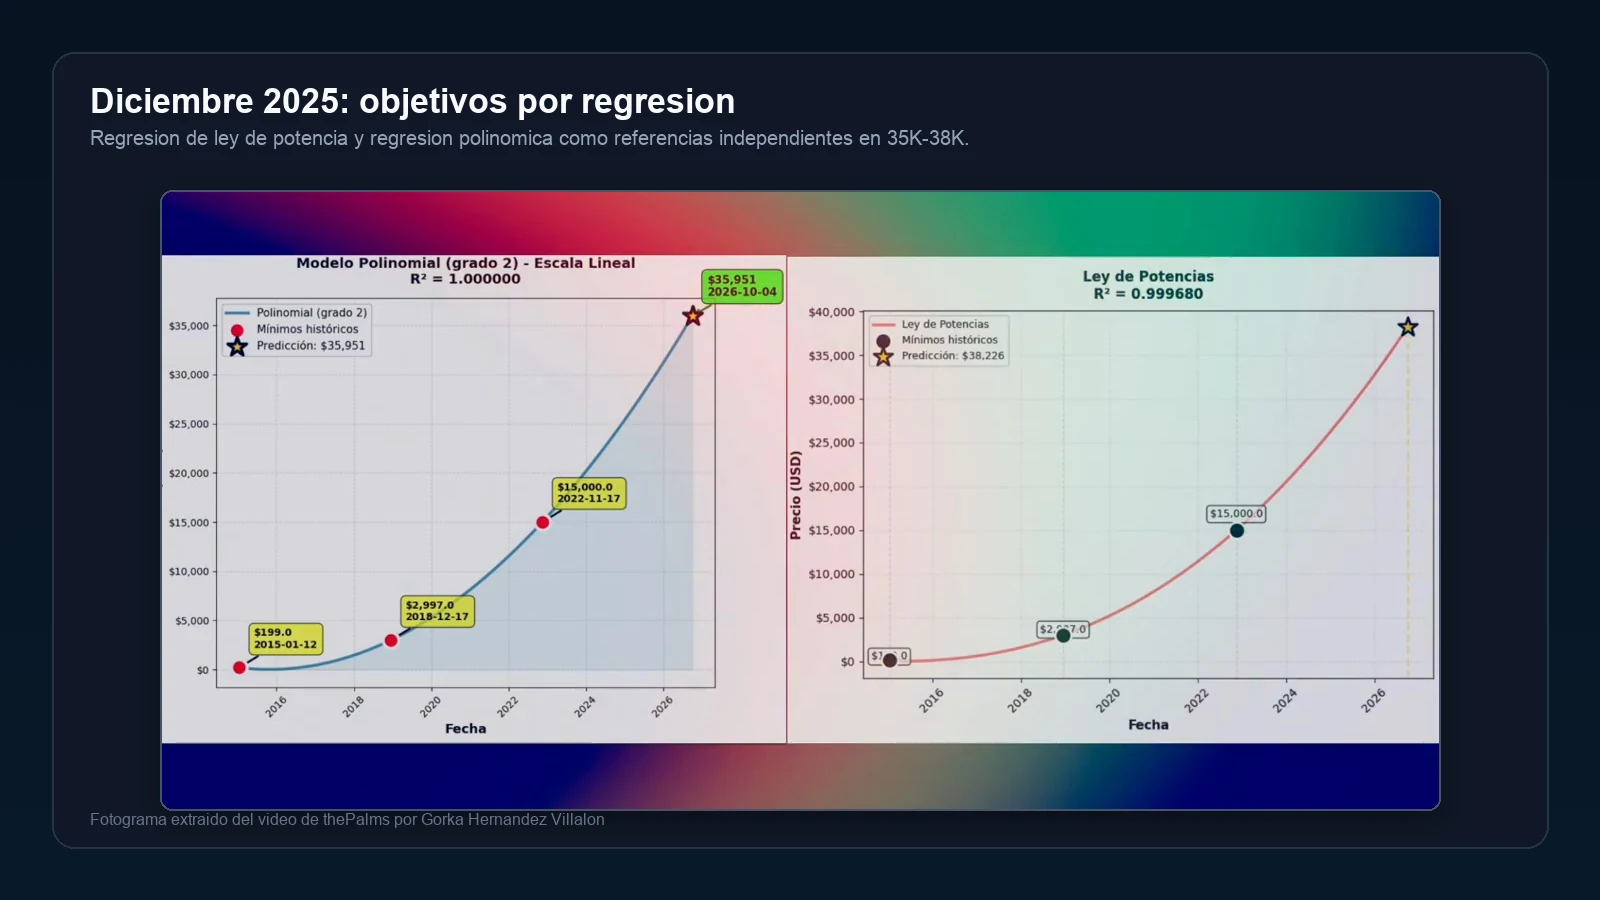
Regressions: power law and polynomial model
The second downside-estimation technique was quantitative. The video shows two models: a polynomial regression and a power-law regression. Both tried to approximate bottom zones using previous market lows and Bitcoin's timing structure.
The visual study produced two zones:
| Method | Approximate result |
|---|---|
| Polynomial regression | 35,951 USD |
| Power-law regression | 38,226 USD |
| Previous bear-market fractal | around 41,000 USD |
That is why I interpret 45K as a practical stress area above the harder model range, not as an exact prediction. The full map was closer to this: 45K as the first relevant psychological level and 35K-41K as the modelled range if the bear market fully developed.
The bull trap I expected
Another part of the December video was that I did not expect a straight line down. I described the possibility of a strong rebound, a bull trap, that could approach 108K-110K, create FOMO and then continue lower.
That part has not played out literally with data available through June 2026. According to Yahoo Finance, BTC did not reach 108K-110K after the December video; the rebound was weaker and the market continued losing structure. This is important: the broad direction aged well, but the exact shape of the rebound was too optimistic.
Current situation in June 2026
As of June 25, 2026, YCharts shows Bitcoin at 60,909 USD, around 42.5% below its value one year earlier. CoinDesk showed BTC near 61.5K USD on its price page. CoinDesk also reported that BTC had recovered the 60K area after trading below it during the week, amid ETF outflows, a stronger dollar and a more defensive macro backdrop.
My current reading would be:
- The 126K-126.5K area worked as a major risk top. It was where the market stopped sustaining the upside extension.
- The correction thesis played out. Bitcoin is far from the high and EMAs stopped being simple continuation supports.
- The 45K move remains open, not confirmed. BTC is near 61K; more structural weakness is needed before calling for capitulation into that range.
- The 108K-110K rebound was the least precise part. The market was weaker than that bull-trap scenario expected.
- The value of the analysis is the process. Resistance, EMAs, cycles, fractality and regression produced a more robust reading than a single trend line.
What I would improve if I repeated the analysis
There are several things I would make clearer:
- separate main scenario, alternative scenario and invalidation;
- distinguish "probable zone" from "stress zone";
- add approximate probabilities, not only price levels;
- document exactly which EMAs were used and why;
- combine technical analysis with liquidity, ETF and macro data;
- save screenshots of every study to compare the thesis with the final outcome.
The 126K call should not hide that. A good analysis is not only measured by whether one area was right, but by whether it helps manage risk when the market starts contradicting a hypothesis.
Related links
- October video: Bitcoin at historic resistance
- December video: seasonality, regression and bear-cycle risk
- Quantitative trading project
- OSINT with LLMs and verifiable evidence
- Professional contact
Conclusion
The full reading was not "Bitcoin falls because it has to". In October, the analysis was still constructive: 122K-124K resistance, correction into EMAs and possible final extension if the pink support held. In December, the model changed because seasonality, cycle timing, the prior bear market fractal and regressions pointed to 126.5K as a possible top.
From June 2026, the core thesis was strong: Bitcoin topped in that area and corrected sharply. The part I would refine is the shape of the decline: the 108K-110K bull-trap rebound did not happen with that intensity. Still, the framework remains useful: when an asset loses resistance, moving averages and cycle structure at the same time, it is wiser to stop assuming automatic upside targets and start working with risk scenarios.